Widgets help you monitor logs in real-time. You can personally set up a widget and add it to a Dashboard of your choice. For example, if you want to monitor the firewall activities of devices, create a widget with the search queries related to the firewall.
Go to Dashboard from the navigation bar.
Click on All Dashboards. Select a Dashboard and click Add Widget.

Adding a Widget
Enter a Name for the widget.
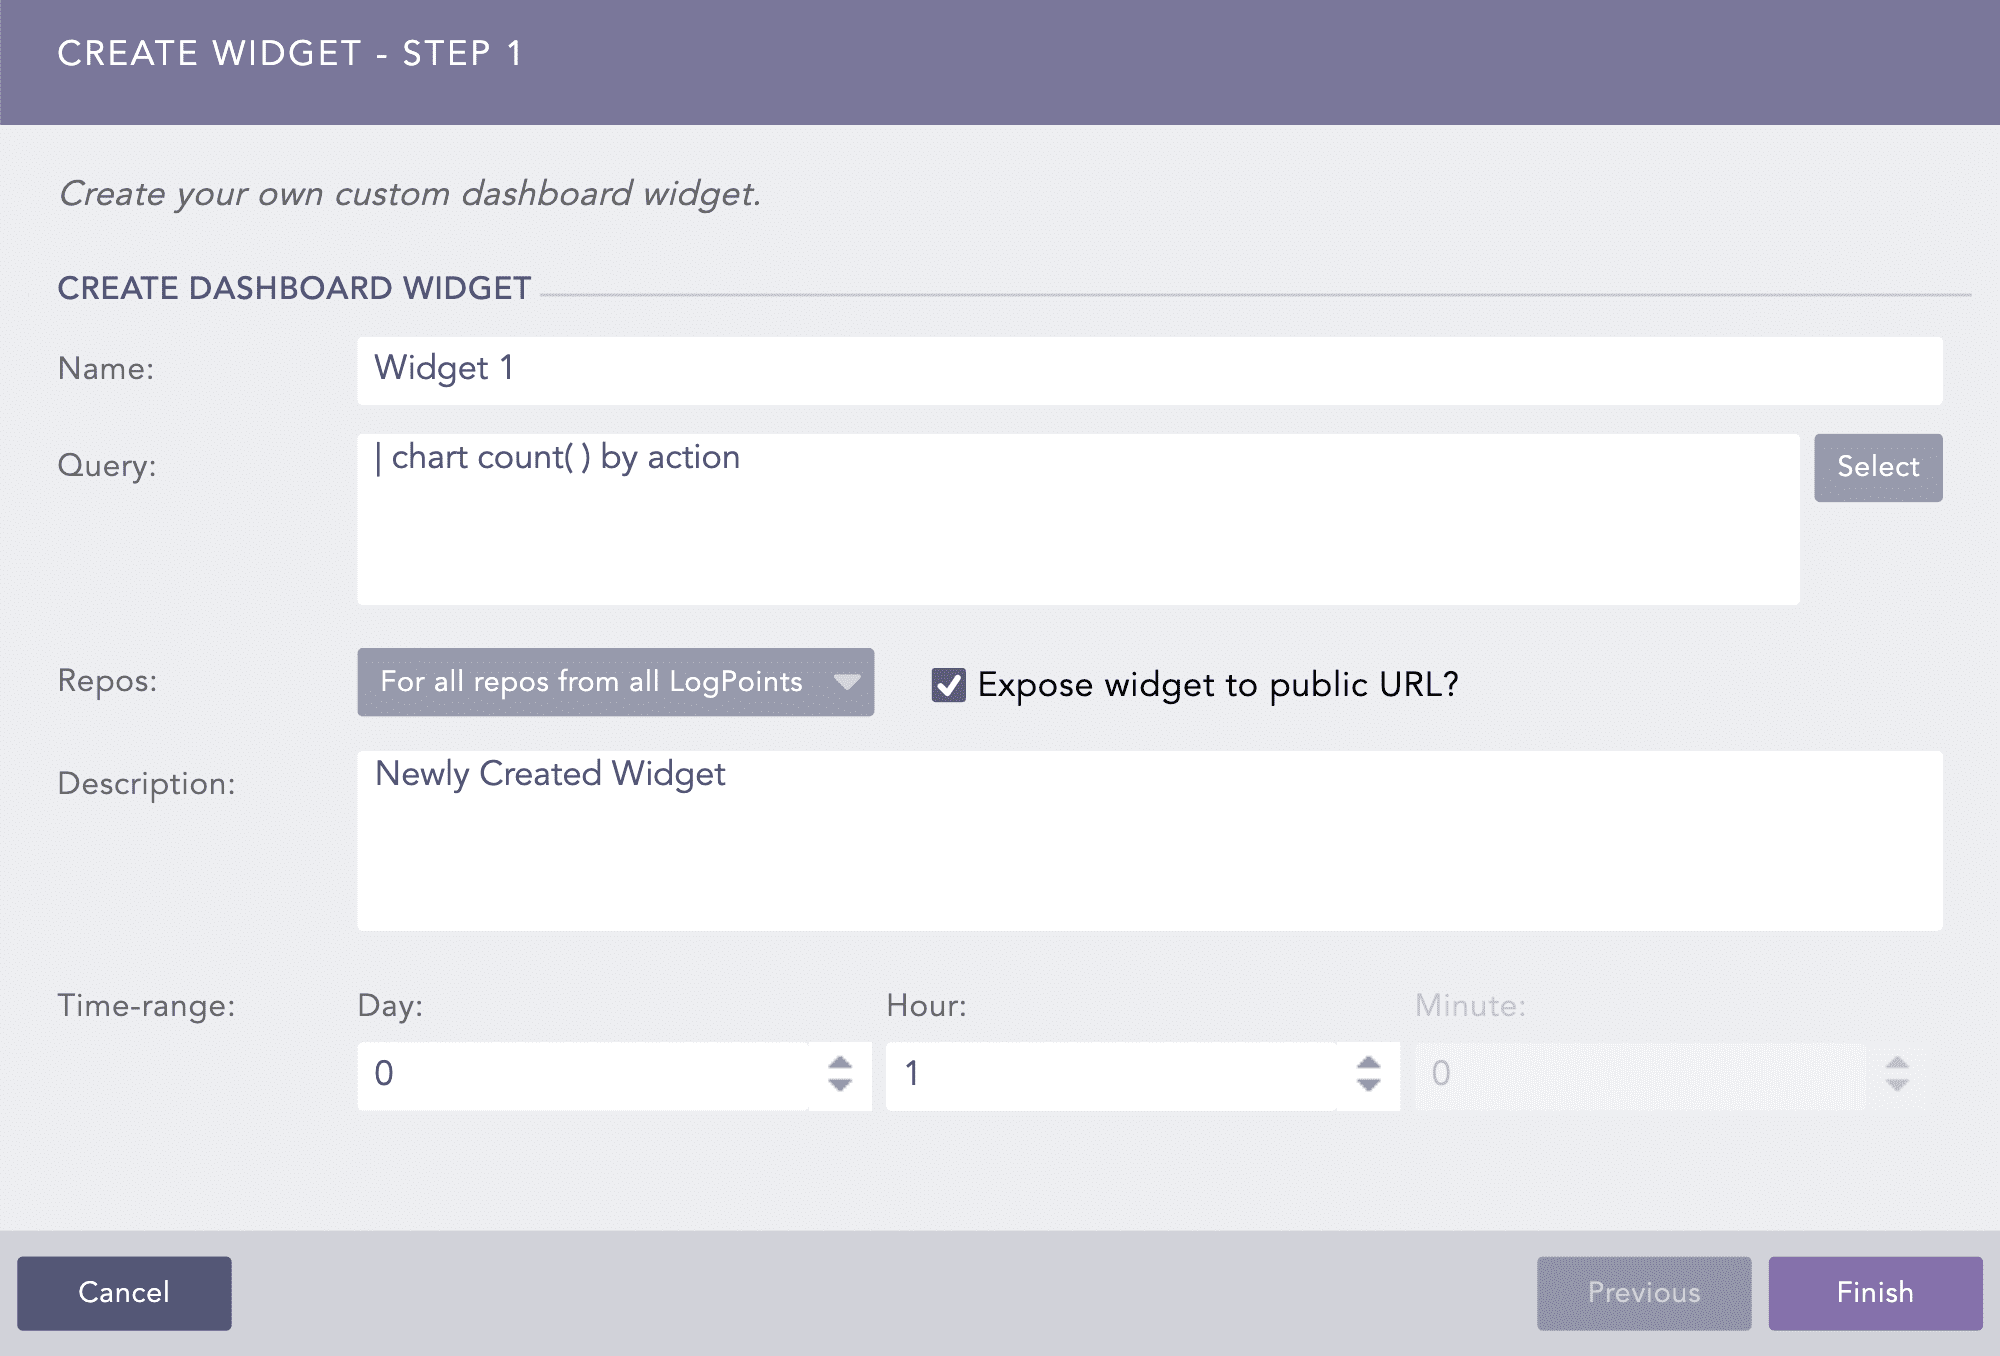
Creating a Widget
Enter a Query. Alternatively, click Select to choose any query from the Advanced Query Picker.
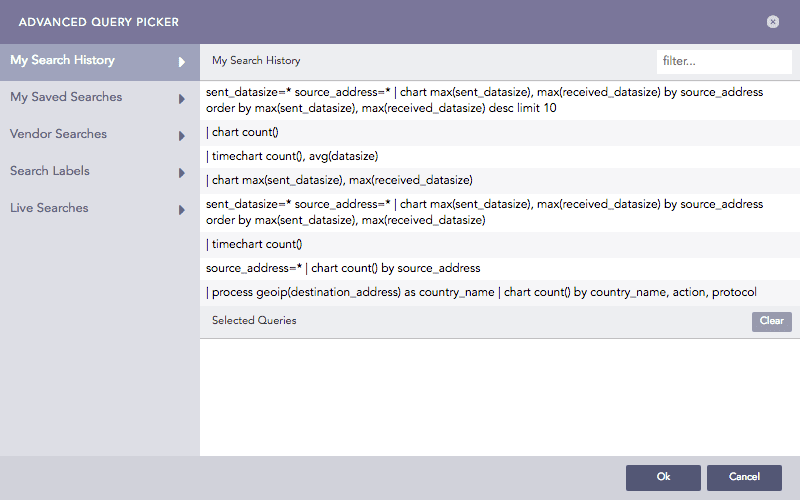
Advanced Query Picker
If you choose the Advanced Query Picker, select a query from the lists.
Choose the Repos from where you want to generate the logs.
Select a Limit for the number of logs generate.
Select Expose widget to public URL? to share the widget publicly. When you share a widget with other users they don’t need permission to view it.
Note
The user the widget is shared with does not need the credentials to view the shared widget.
If you selected Expose widget to public URL?, you now have the option to Open public URL. Click it opens the search results in a new window.
Open Public URL
Provide a Description for the widget.
Select a Time Range for the logs in the repos.
Note
You can set a time range in minutes, hours, or days..
The maximum limit of the time range for the day field is 30.
Click Finish.
Note
If Data Privacy Module is enabled, Can Request Access users can only view encrypted data.
Warning
When configuring repos for a new dashboard, only select the relevant ones. Using a large number of repos impacts Logpoint performance.
At the top-right, click the Widget Options icon.
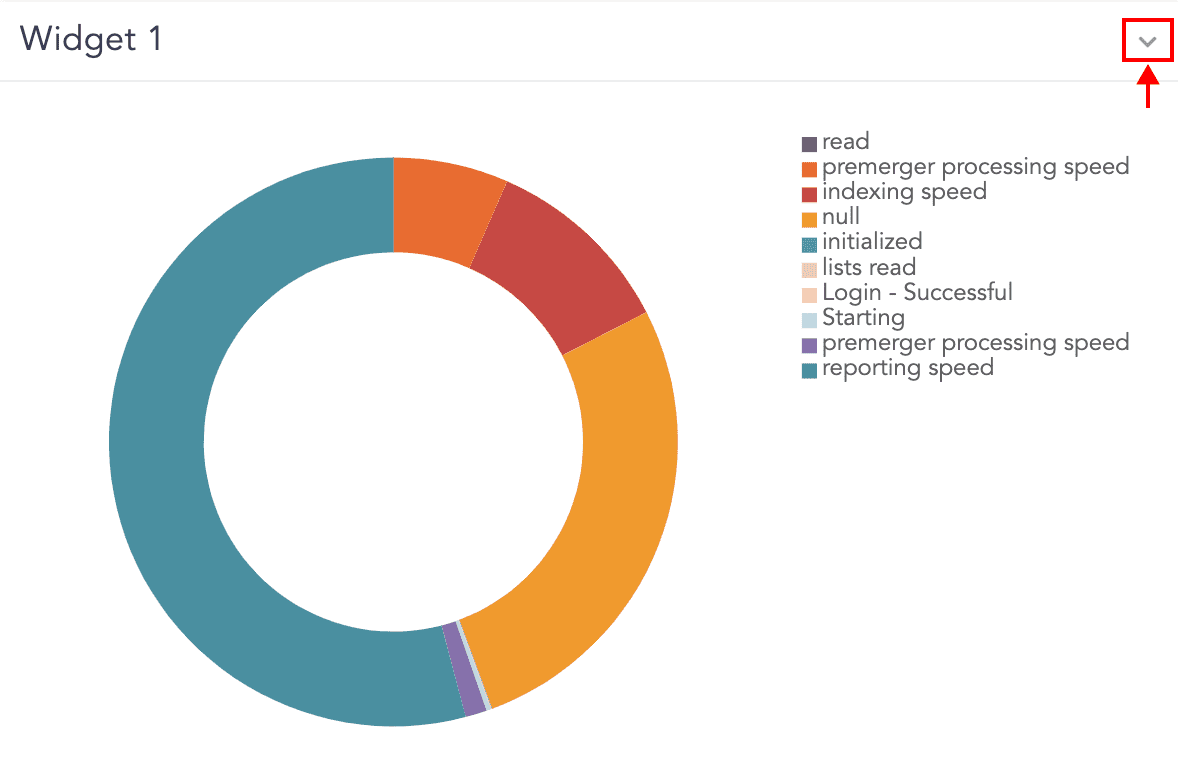
Widget Options Icon
Edit a widget options include:
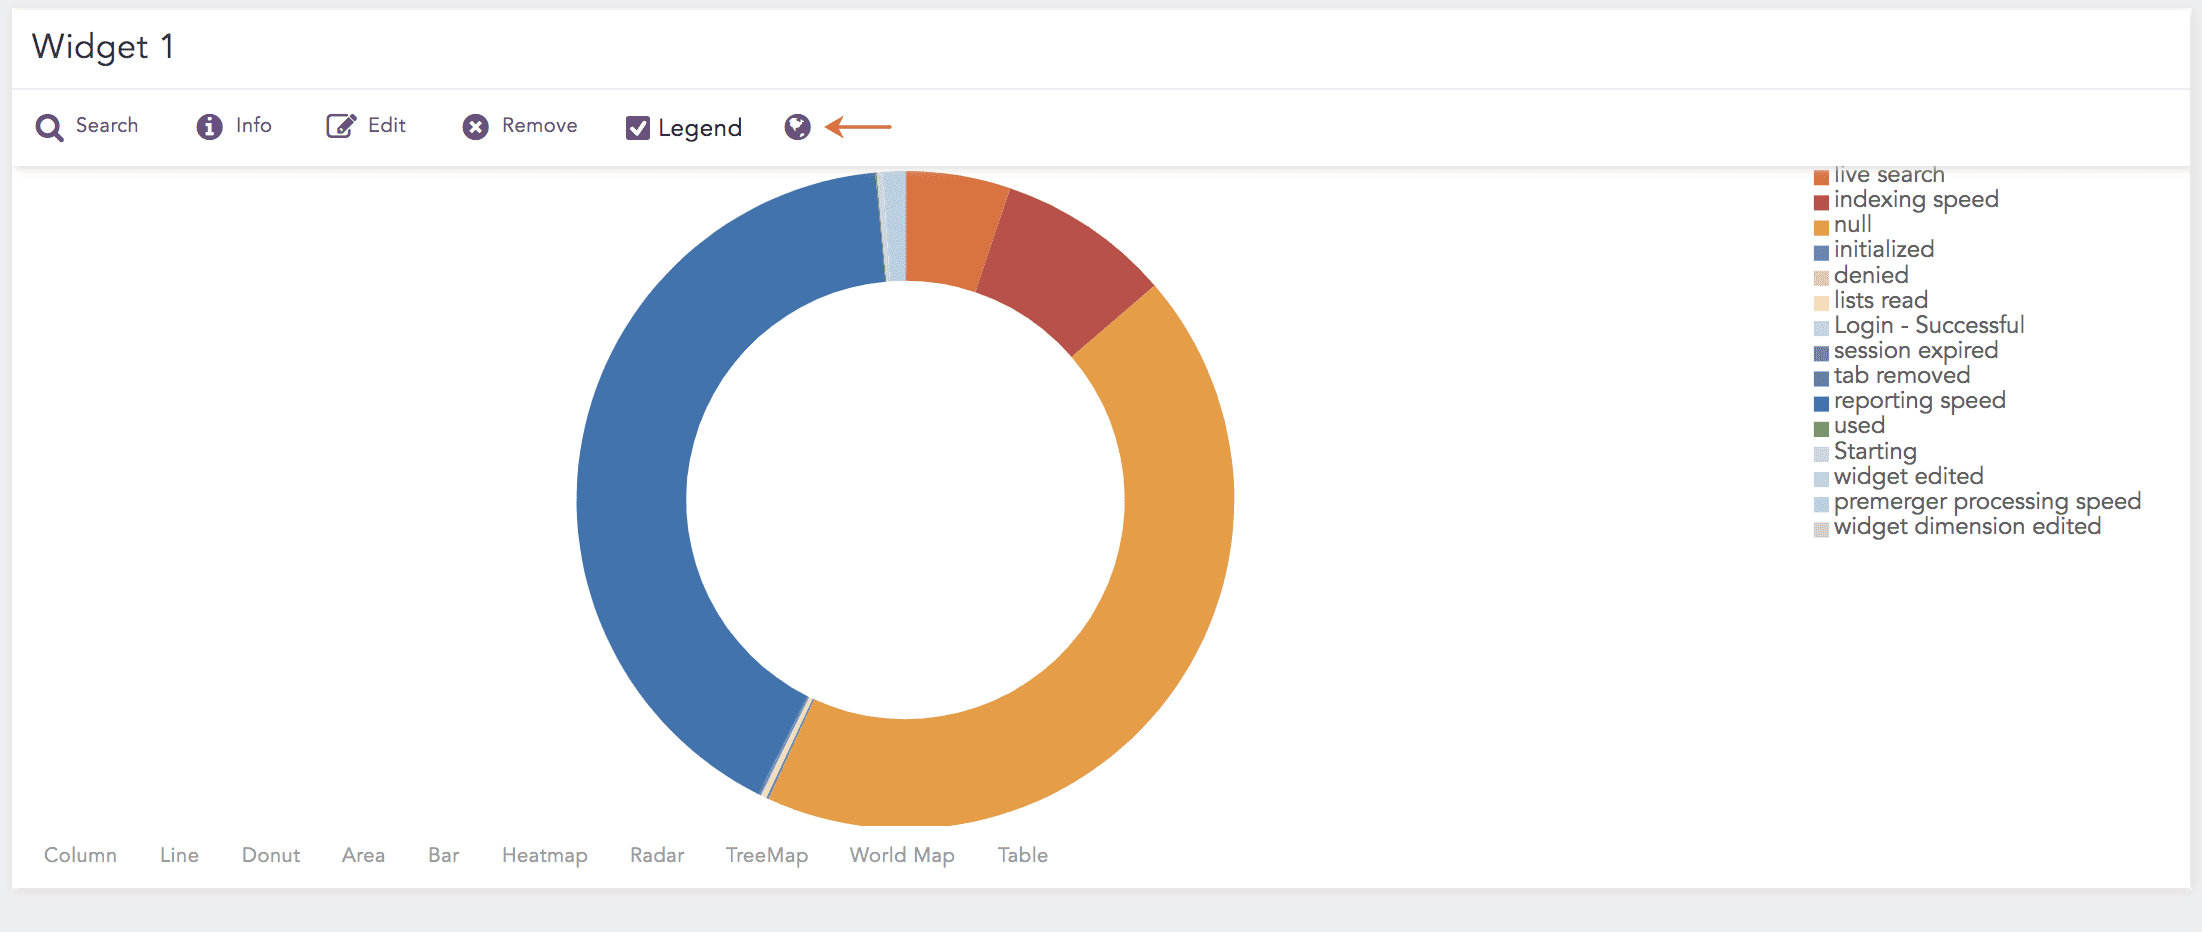
Widget Options
You can Search for the results, get Info, Edit, Remove, and open the widget in Public URL. You can also toggle the display of the Legend if there is one.
Additionally, You can create Alerts and Incidents. Go to Alerts and Incidents in Search and Analytics for details.
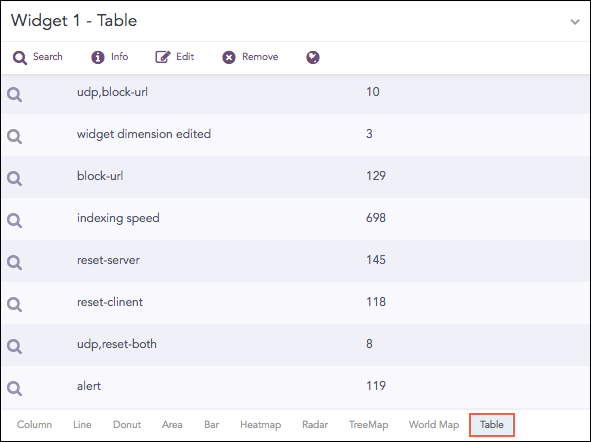
You can also create and use graphs, including tables, area charts, line charts, bar charts, column charts, gauge charts, display charts, and donut charts. The type of graph you can use depends on the type of search results.

Create Report Option
You can use dashboards to generate reports. A report replicates the contents and data in a widget. You can’t schedule or change a report’s layout in a widget.
To create a report using a Dashboard, go to Creating Reports in Reports.